The information contained in this article is not intended as legal advice and may no longer be accurate due to changes in the law. Consult NHMA's legal services or your municipal attorney.
Shocking I know, but not everyone likes to have conversations about demographics: the numbers, the changes in percentages, and let’s not even talk about the graphs. But for this article, we hope you put aside any grievances you may have about numbers in general and consider what they tell us. The statistical data we are sharing includes changes in our state’s population, school enrollment, and diversity in population. Whether you find some of the changes surprising or not, they will beg the question, why are the changes important and what, if anything, should my community do about it? There’s a story here and we hope you are willing to consider what it may mean for your community and New Hampshire.
New Hampshire’s Changing Population
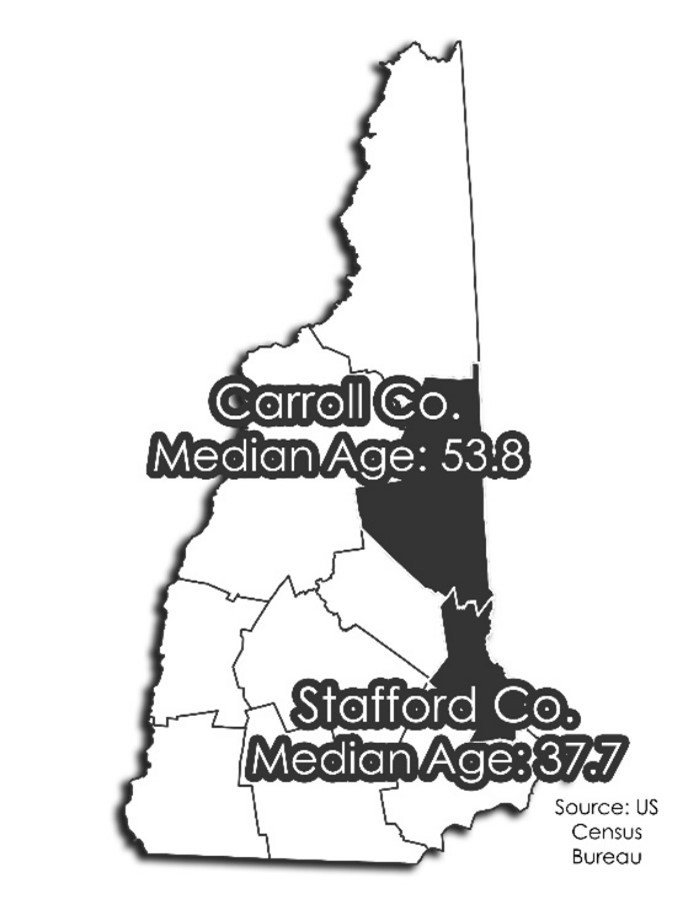
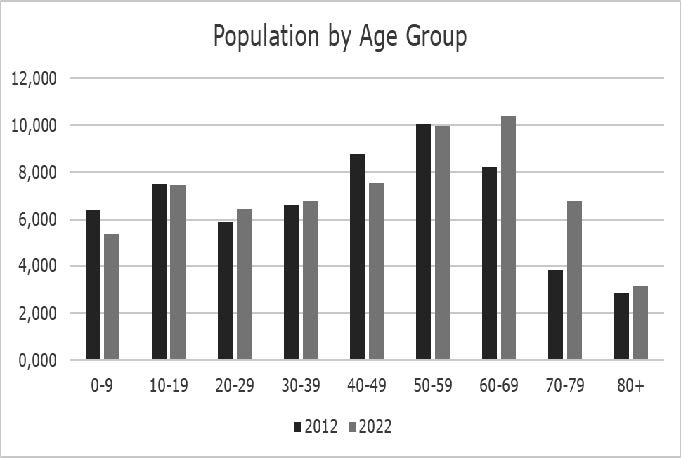
There are two age groups in New Hampshire that are growing: people over 60 years old, which may not come as a surprise, but also people 20-39 years old. The population over 60 years old is up 40% (over 105,000 people) and the population 20-39 is up 11% (or about 34,500 people) from 2012. As of the 2022 American Community Survey (US Census Bureau), New Hampshire was the third oldest state in the US. Continuing to look at 2022 numbers, the statewide median age was 43.1 years (up from 41.1 in 2012). The youngest county was Strafford County, with a median age of 37.7 (up from 36.7 in 2012), and the oldest county was Carroll County with a median age of 53.8 (up from 48.2 in 2012). The first chapter of the story is simple, New Hampshire is aging. We are typically one of the top five oldest states along with Maine, Vermont, West Virginia, and Florida. Naturally, as we age our needs and wants change. As planners it’s vital to ask our communities, agencies and businesses if they recognize the growing needs of an aging population. A survey for the NH State Plan on Aging in early 2023 found that 91% of adults over 65 found access to healthcare and ability to maintain physical health as very important to their ability to age in place. When asked to rate their community’s ability to meet their needs to age in place, 19% of respondents over 65 rated their community “Poor”, and another 34% said “Fair”. Only 10% said their community is in a “very good” position to meet their needs. An age-friendly community is one that embraces the concept that there should be programing, services and infrastructure for people of all ages and abilities. Communities can conduct their own self-assessment of their services by asking questions such as: Do we have walkable streets? Do we have a transportation system for older residents who need to retire from driving? Do we have programs in place to assist older residents to remain safely in their homes? And on the flip side: can we attract younger adults to work in our many businesses and industries to support our communities?
The Domino Effect of Population Decline
While there are many factors that shape state and regional economies, population change is perhaps one of the most fundamental. During the period between 2010 and 2020 the Southwest New Hampshire region saw its first decline in population in a century, (since 1910 – 1920). Between 2010 and 2020, the total population of Southwest NH declined from 100,751 to 100,307, a loss of 444 people or just under 0.5%. The modest decrease in population occurred against a backdrop of positive yet slowing national growth. The decline in the region’s population raises a number of economic challenges, something we’ve all noticed especially since COVID: help wanted signs. It seems that in every corner of the business sector, from engineers and planners to grocery store clerks and restaurant staff, there are staffing shortages. The bottom line is that with a shrinking population, employers are limited in their ability to maintain or expand their operations. Could the shrinking population really impact the availability of southwest NH’s workforce? Remember New Hampshire is aging, and unfortunately this means our workforce is aging. As more and more NH’s citizens are retiring, they age out of the workforce. What is the result? In every conceivable office from oak-trimmed boardrooms to back-alley kitchens, you can hear the questions: who’s going to do all the work, how do we fill these vacancies, and how can we attract a younger workforce? In an environment where many sectors of the economy report significant recruitment and retention challenges, trends in labor force participation signal a competitive disadvantage for southwest NH. The region is more rural, older and stagnant in job growth than other parts of the state. As the limitations on workforce become more severe as the nation ages, local efforts to promote in-migration of working-age households and to utilize the existing workforce to its greatest potential will become more important than ever to ensure a healthy and vibrant economy.
What the Numbers Tell Us About School Enrollment
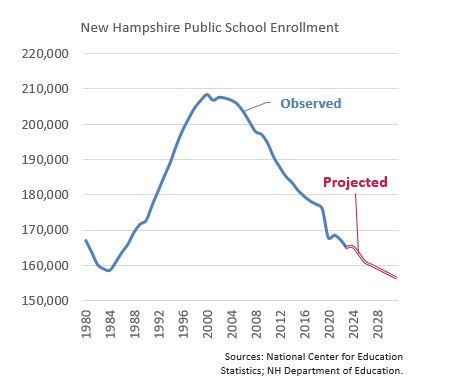
The aging of NH is visible in school enrollment as well. Public school enrollment in NH peaked in 2000 and has fallen ever since.1 This tracks with the decrease in school-age children statewide. The total number of NH residents under 18 years old was highest in 2000 and has decreased by 53,000 or 17% since then. The percentage of residents who are minors has been falling for decades, 46% since 1970.2 Towns like Candia experienced a 24% drop in public school enrollment between 2013 and 20233 and a 56% drop in the number of minors per household compared to 1980.4 Even in towns where public school enrollment has grown in recent years, the number of minors per household continues to decline. Enrollment figures for private schools are more difficult to obtain but their general trend is also down. Enrollment numbers are projected to continue declining in the near future.5 However, they could recover somewhat in the 2030s as the children of millennials reach school age.6
New Hampshire and Diversity: Immigrants, Cultural Diversity, People of Color
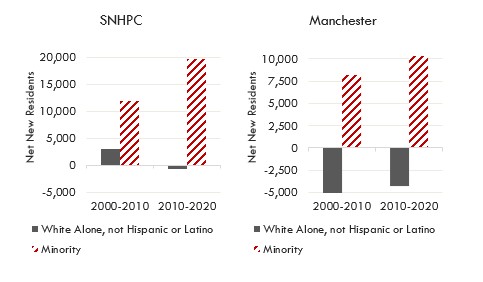
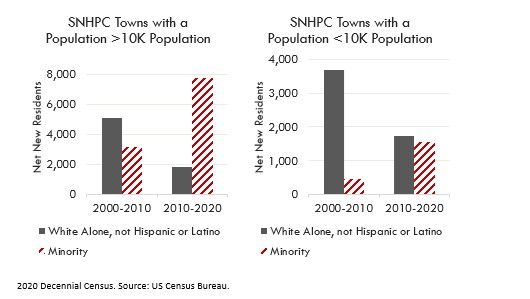
With the 2020 census, New Hampshire became the fourth least diverse state in the country (previously it was the third). Over 175,000 granite staters identify as a racial or Hispanic or Latino minority. While a minority rate of 13% is much lower than the national rate of 42%, it is growing quickly, and especially among younger residents. The number of minorities living in NH over the past two decades grew by 192% compared to just 11% for the general public. That’s around 116,350 net new minority residents over a 20-year period. Within the Southern New Hampshire Planning Commission (SNHPC) region the growth rate was roughly the same at 188%. However, looking at these total numbers obscures stark differences when it comes to age. In the city of Manchester, a person under the age of 18 is twice as likely to be a racial or ethnic minority than an adult. Interestingly, that pattern continues in outlying communities like Bedford, Candia, Deerfield, and Londonderry.7 Looking at the growth graphically, you can see the comparison of net new residents for the past two decades in the SNHPC region, in Manchester, towns in the SNHPC region with a population of at least 10,000, and towns in the SNHPC region with a population of less than 10,000 residents. Growth of new residents is separated into whites and minority For the past decade, one can see how minority growth has increased substantially and in Manchester, the number of new white residents has actually declined in both 2010 and
2020. Between 2010 and 2020 in towns with a population of 10,000 or more, the number of net new minority residents was more than four times higher than it was for new white residents. The growth in white and minority residents was nearly equal in towns of less than 10,000 during that same period.8 There can also be diversity within small groups. In 2020, the number of Asian-American residents in NH, who were also not multiracial and not Hispanic or Latino, was around 35,500 or 2.6% of the state’s total population. Asian-Americans differ widely across the state both by ethnic background and geographic distribution. For example,
in 2020, more than half of the roughly 15,600 South Asian-Americans in NH (8,600), lived in Hillsborough County. Nashua has a much larger South Asian population compared to Manchester, 5% verses 2% of the city’s total population. The compositions of the South Asian populations differ as well. While 90% of Nashua’s South Asian population is of Indian descent, Manchester is more diverse with Indian-Americans making up only 35% of the South Asian community. Larger numbers of residents with Bhutanese, Nepalese, and Pakistani heritage can also be found.
Conclusion:
To be sure, awareness of the changing demographics may suggest shifts for decision makers, a basis for redirection in funding, and awareness for the need of additional services. We hoped to raise awareness of the changing demographics and pose the following questions for consideration:
- How are NH communities providing services and programs that support residents of all ages and abilities?
- Is my community’s infrastructure accessible to everyone from Mom’s with strollers to people in wheelchairs?
- How are communities promoting in-migration of working-age households?
- How can NH agencies utilize the existing workforce to its greatest potential?
- How are NH communities welcoming diverse cultures?
- Can we create a strategic plan that showcases agencies best suited to collaborate with communities to ensure an age-friendly NH?
1. Sources: NH Department of Education; National Center for Education Statistics.
2. Decennial Censuses. Sources: IPUMS National Historic Geographic Information System; US Census Bureau.
3. Source: NH Department of Education.
4. Decennial Censuses. Sources: IPUMS National Historic Geographic Information System; US Census Bureau.
5. Source: National Center for Education Statistics.
6. Source: NH Department of Planning & Development.
7. 2020 Decennial Census. Source: US Census Bureau.
8. 2020 Decennial Census. Source: US Census Bureau.
i. ACS 2012 & 2022 5-YR estimates. Tables B01001, B01002
ii. https://www.dhhs.nh.gov/sites/g/files/ehbemt476/files/documents2/beas20…