NHARPC CORNER: Supporting Walkability and Accessibility
Primary tabs
The information contained in this article is not intended as legal advice and may no longer be accurate due to changes in the law. Consult NHMA's legal services or your municipal attorney.
What do we mean by the terms, walkability and accessibility?
Stated simply, increasing walkability and accessibility eliminates barriers to mobility. Consider an important local destination, such as a school or downtown area. Walkability depends on wide sidewalks in good condition, without obstructions like trash cans or utility poles, that connect to places people need to reach. Accessibility features might include things like readable wayfinding signs and pedestrian signals with auditory cues for people who are visually impaired. Safety factors like the speed and volume of vehicles will also determine accessibility from a pedestrian’s perspective.
Why do planners promote walkability and accessibility?
New Hampshire’s regional planning commissions (RPCs) regularly work with communities on revitalization efforts, particularly to create hubs for economic development and civic involvement. In doing so, they might address questions such as, is the streetscape inviting for people to linger and visit multiple storefronts? Can people walk or bike from their homes or parking lots to their destination? Can students walk from their home to school? Could a person get from their vehicle to their destination if they were in a wheelchair? Currently 13% of people in New Hampshire have mobility, hearing, vision, or other disabilities—a proportion expected to increase as the state’s population ages. Is the built environment keeping this growing disabled population from reaching critical local destinations and participating in the economy?
What do we mean by the terms, walkability and accessibility?
To progress towards the goal of a more walkable and accessible transportation network, it is first necessary to understand current conditions, then make recommendations about what improvements are needed and where. The following is a sampling of innovative approaches RPCs are using to capture existing conditions in a planning study area, and how these observations are used in analysis to inform local decision-making.
SADES Pedestrian Infrastructure Assessments: In the summer of 2019, Strafford Regional Planning Commission (SRPC) staff assessed all sidewalks within the City of Rochester, and in 2020 and 2022, Nashua Regional Planning Commission (NRPC) staff assessed all the sidewalks in the City of Nashua. Both assessments’ objective was to measure the condition and relative accessibility of city-wide sidewalks, crosswalks, and curb ramps. Using the Statewide Asset Data Exchange (SADES) framework and ArcGIS mobile technology, sidewalks were measured according to 16 different values such as slopes, widths, clearance, and obstructions. Each curb ramp and crosswalk was also assessed independently, with over 10 different values collected at each asset.
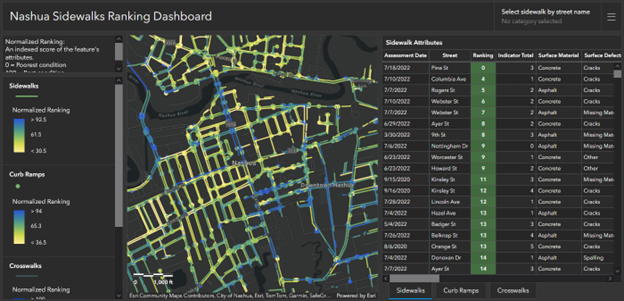
Interactive dashboard used to visualize the results of field data collection
In the case of the Nashua project, assets were analyzed through a robust spreadsheet exercise that scored assets on their condition attributes. Once scored, sidewalk segments were ranked by relative condition, and areas with higher concentration of assets in poor condition could be identified. Armed with these results, the city is better able to prioritize repairs and make more cost-effective investments overall.
Walk Audits: Additionally in Rochester, SRPC staff and volunteers conducted an accessibility audit of all sidewalks, curb ramps, and road crossings within the downtown area of the city, regardless of ownership. Using a “walk audit” methodology developed by the American Association of Retired People (AARP), teams of volunteers and city staff recorded data and took photos on the condition, safety, and appeal pedestrian infrastructure.
Volunteers and staff took photos of any defects or barriers to help Rochester Public Works determine the appropriate action. The data collected will allow Public Works to look at the downtown area with a finer tooth comb to address specific issues on each road segment.
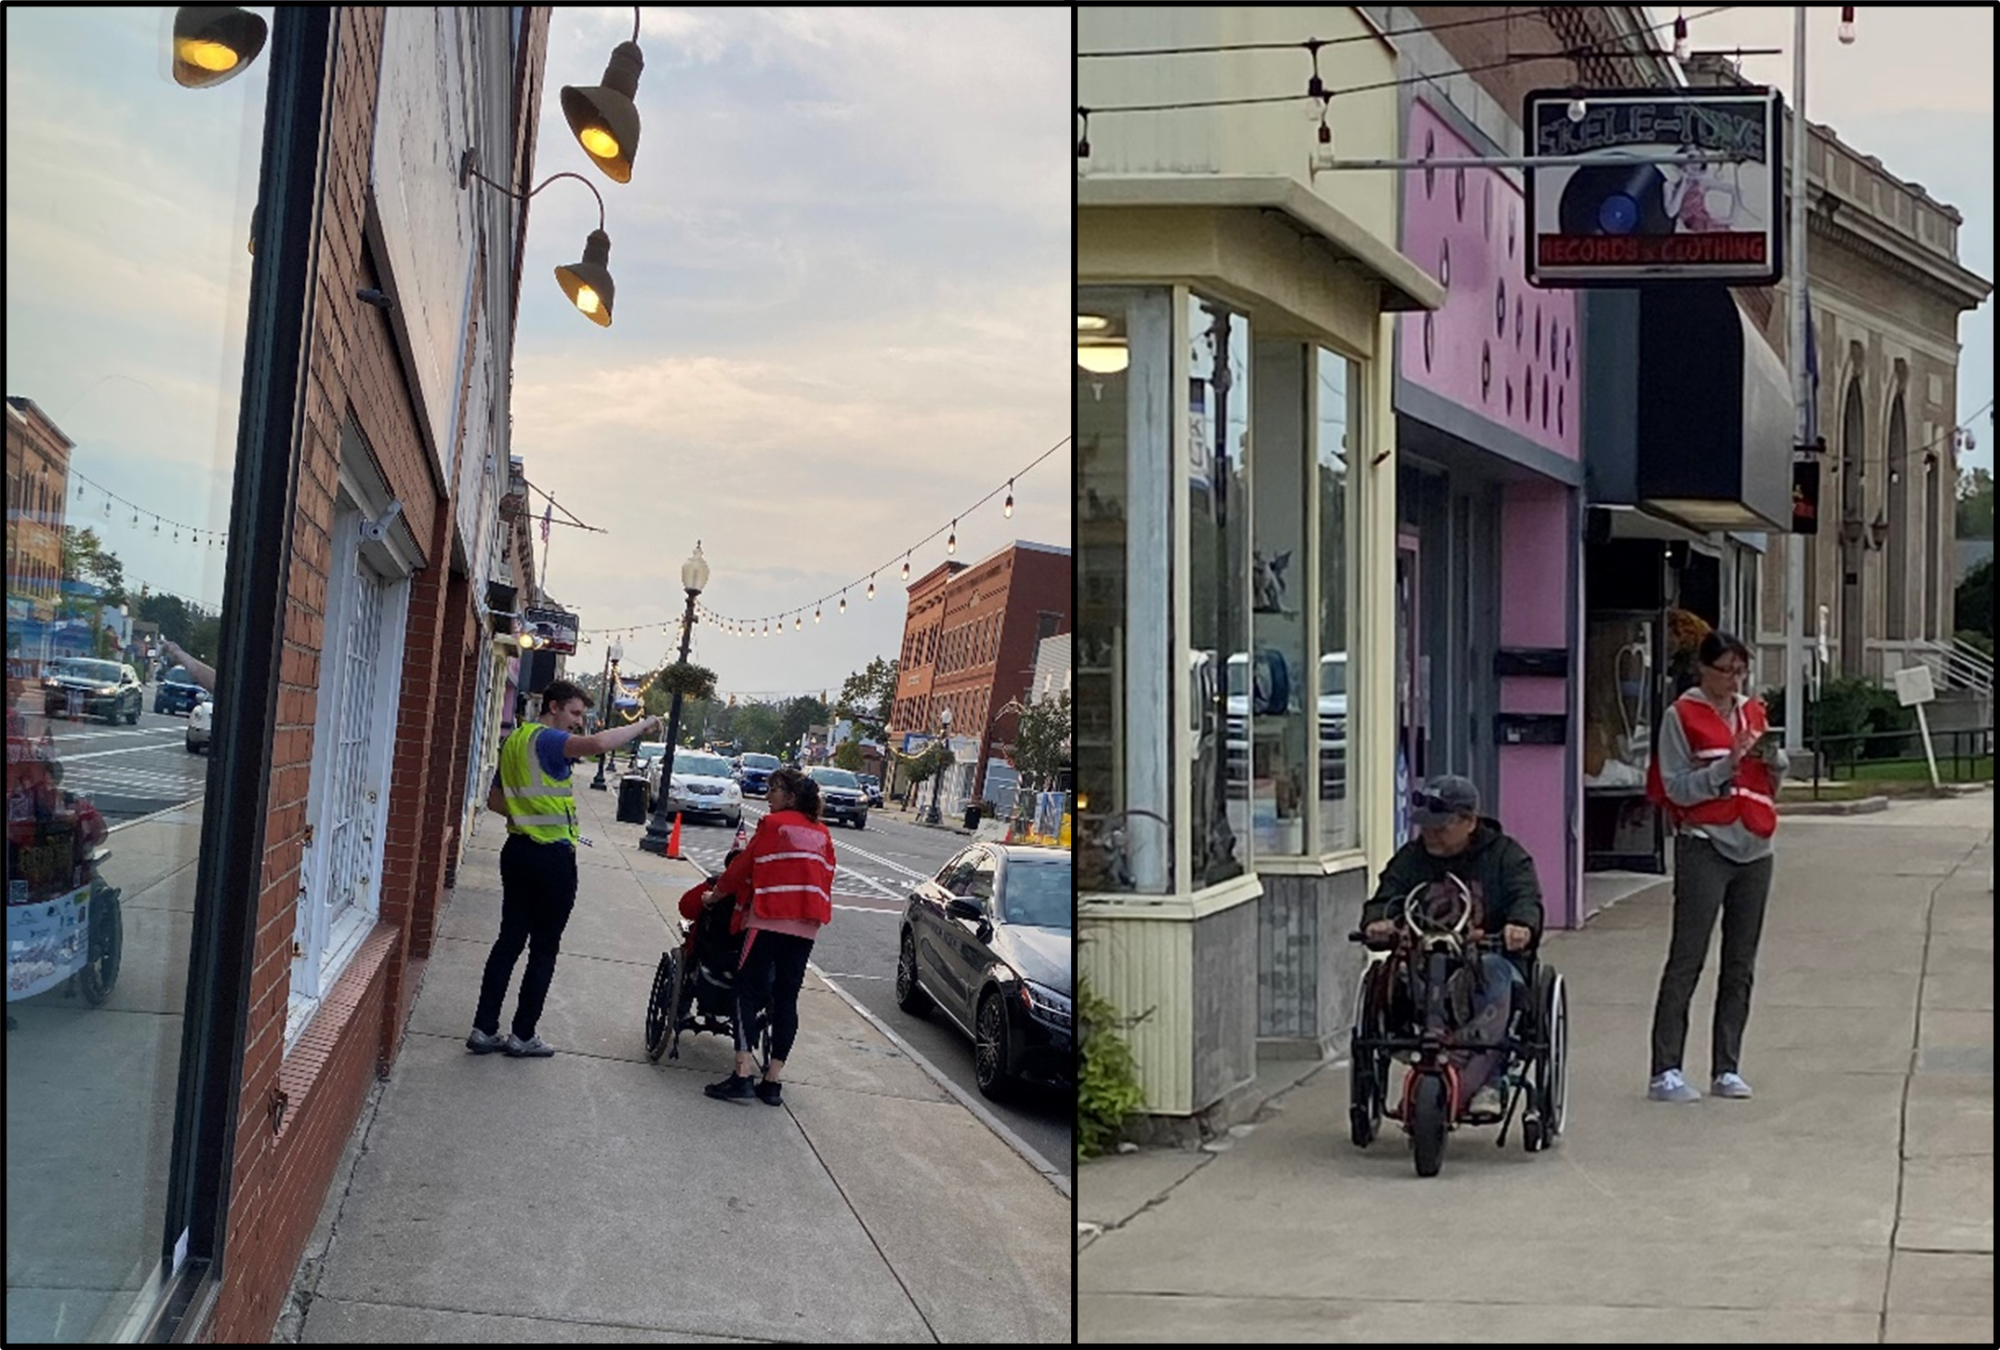
Strafford RPC and Rochester staff assessing downtown streets with people with disabilities to understand where barriers exist in the streetscape.
Transit Accessibility Study: Strafford and Rockingham RPCs are currently working on a study of the safety and accessibility of sidewalks within the fixed route bus network in their regions. They are assessing the condition of sidewalks and crossings as well as traffic volumes and speeds, to identify places where improvements could make it safer and more comfortable for people to access the bus. Planning commission staff will be working with the Cities of Dover and Portsmouth to draft ordinance for making transit accessibility improvements when new developments are proposed near bus stops.
Bicycle and Pedestrian Traffic Counting: The RPCs continually collect bicycle and pedestrian traffic data along sidewalks, multi-use paths, and recreational trails. NRPC deploys four mobile “Eco-counters”, which are typically moved every two weeks to count traffic at new and recurring sites across the NRPC region.
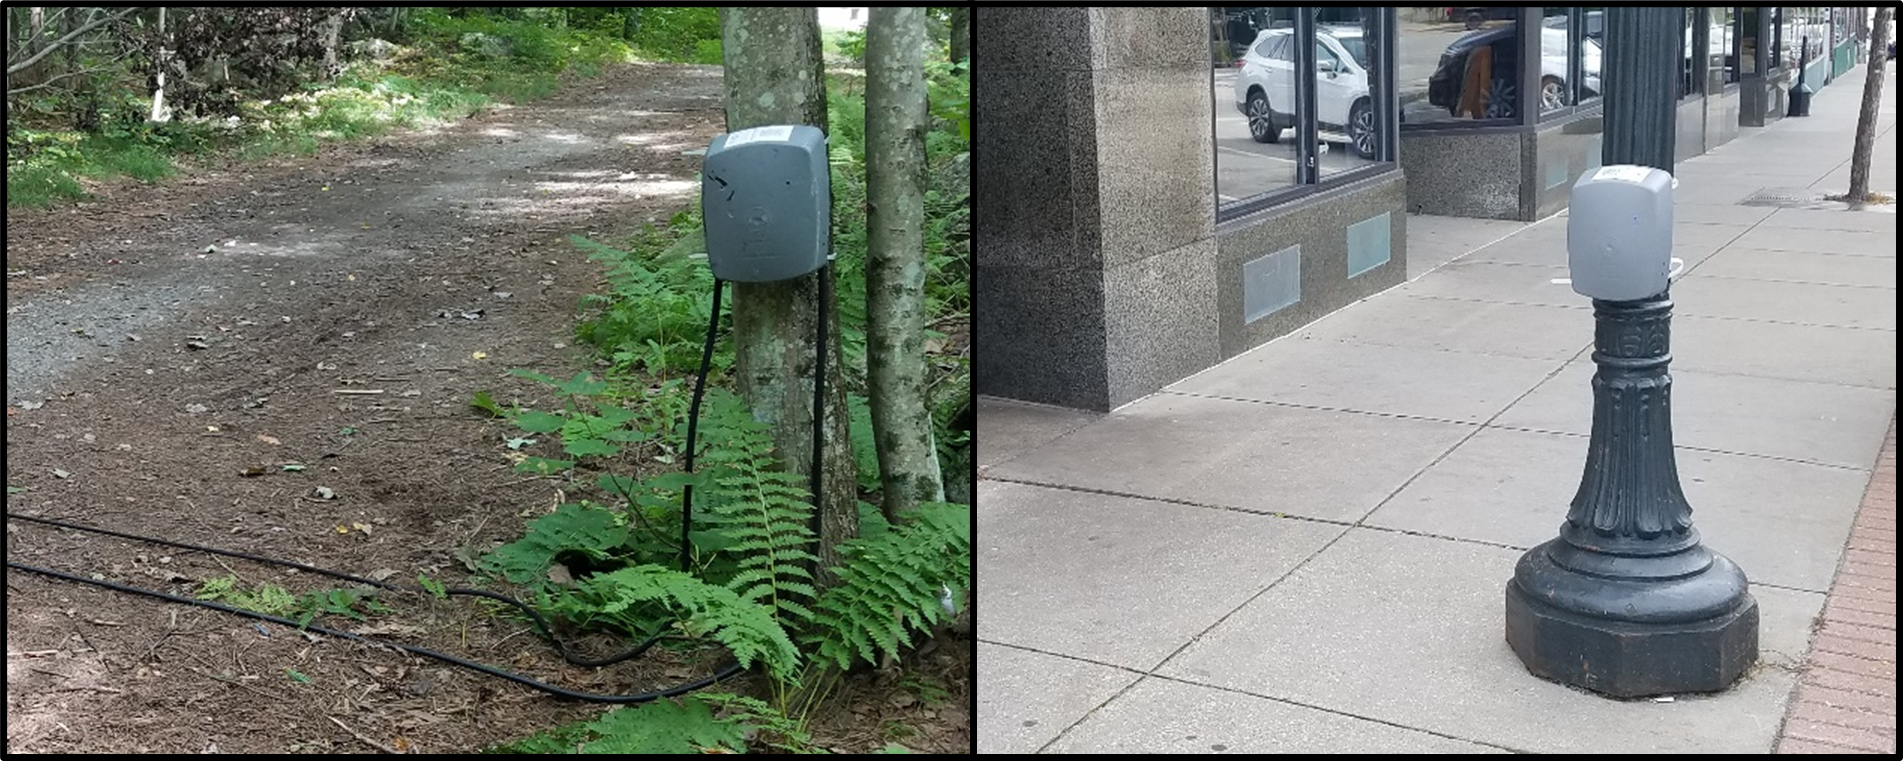
Eco-counters placed on an unpaved trail (left) and sidewalk (right).
Data collected from these counts are used to analyze trends in bicycle and pedestrian activity and aid in project planning to accommodate and promote safe, non-motorized transportation and recreational travel. Counting how many people are walking, biking, or scooting on a road or at an intersection can also help planners and engineers identify and justify where sidewalks, crosswalks, or paths need to be built or improved.
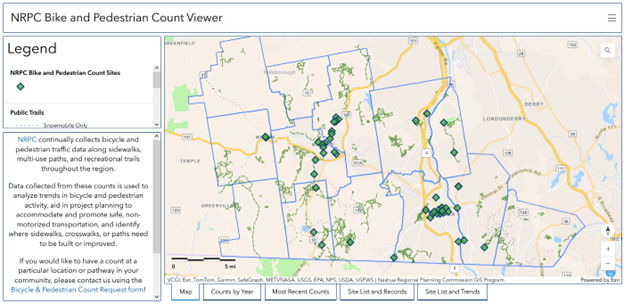
NRPC Bike and Pedestrian Count Viewer
Public Outreach: The examples discussed above illustrate the value of quantitative data collection and assessment to drive objective decision-making. These activities, while highly valuable and effective, cannot be conducted in a vacuum. Public input can provide a “reality-check” on the data as well as educate local leaders on the collective perceptions, interests and priorities of their constituents. RPCs regularly use surveys and conduct in-person or virtual outreach events to gather this important input.
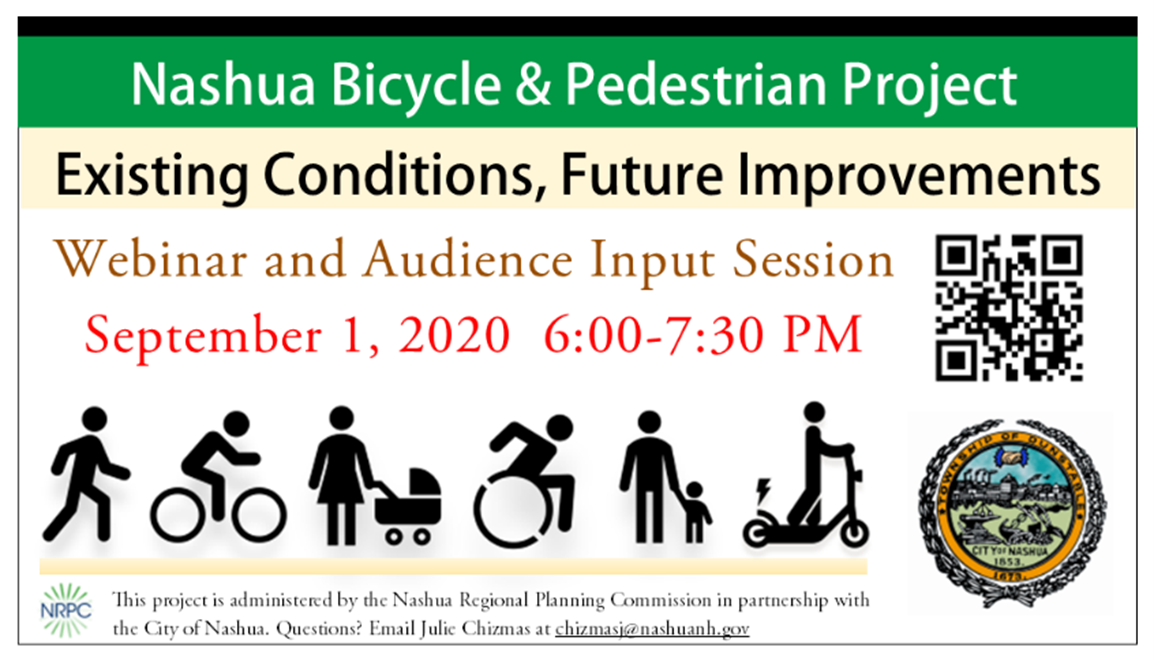
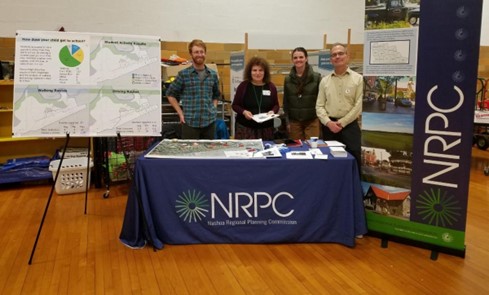
Left Image: Flyer for virtual outreach event; Right Image: In-person event
Online Resources