How We Fund Public Services in New Hampshire
The information contained in this article is not intended as legal advice and may no longer be accurate due to changes in the law. Consult NHMA's legal services or your municipal attorney.
Government revenue is critical to funding all public services, such as schools, infrastructure, public safety, and protected lands. Different levels of government in New Hampshire are responsible for delivering separate sets of services, and these levels raise funds in varying manners. Funding also moves between different levels of government, with the federal government supplying a substantial amount of money to the State government, and the State contributing funding to local governments through grants. These fiscal relationships make revenue and expenditure decisions at each level interact in inextricable ways, and decisions in both Concord and Washington, D.C., can have direct and cascading impacts on local budgets in New Hampshire.
New Hampshire collects revenue in a unique variety of ways. Notably, not all services are funded through taxes. At the State level, myriad tax revenue sources only accounted for about 38 percent of all revenue to fund services in State fiscal year (SFY) 2017. The rest came from revenue generated by charges for services and grants, including grants from the federal government to run certain programs. Federal grants, most notably for Medicaid, provide a third of funding for State programs, only 5 percent less than State tax revenue. However, while the State government uses a diverse array of taxes on different economic activities, local governments rely on one major tax source: the local property tax.
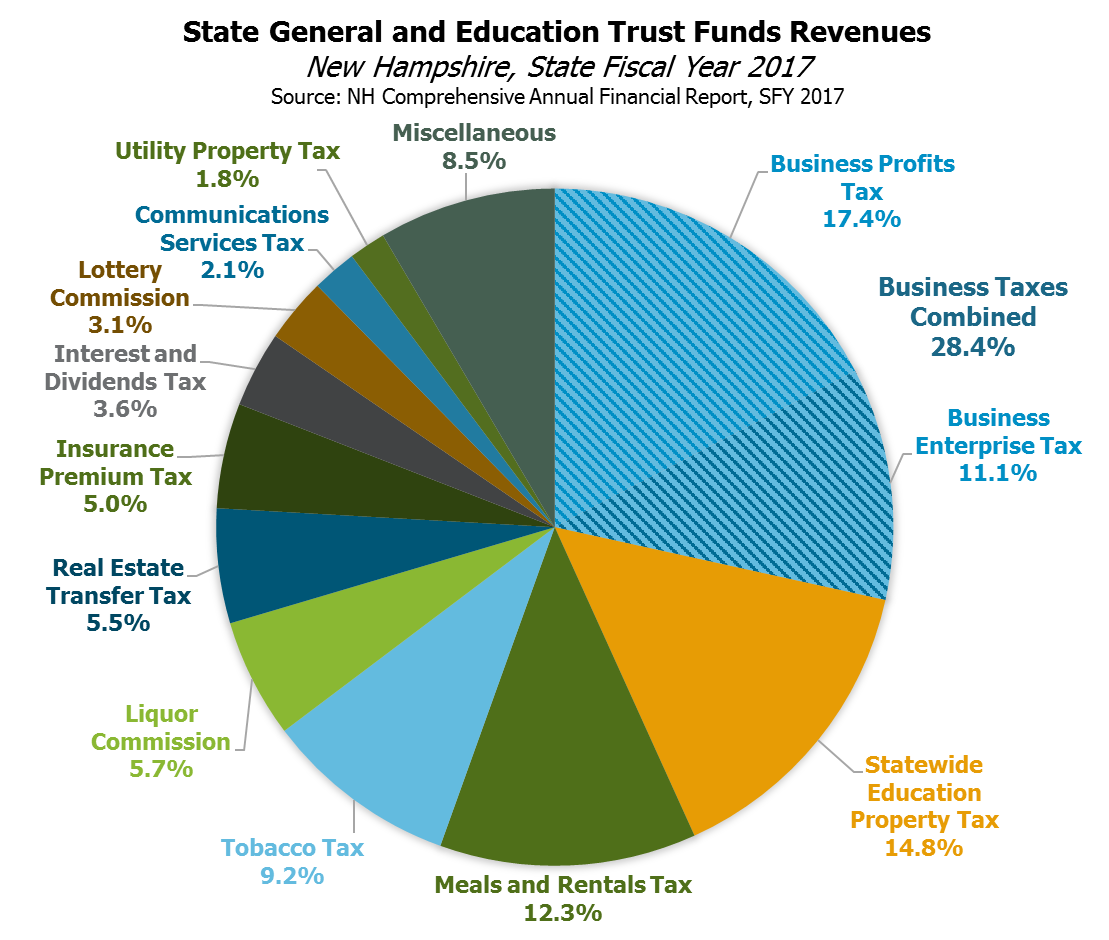
Table 1: State General and Education Trust Funds Revenues
The State Revenue System: An Overview of Major Sources
The State’s primary revenue sources, discussed below, each provide insight into one component of how the State collects revenue. With a relatively large number of mid-sized sources, New Hampshire’s State revenue system is complex, and interactions with local and federal budget funds contribute to an intricate picture.
Driving Revenue Growth: The Two Business Taxes
New Hampshire levies two primary taxes on businesses, which are among the largest sources of revenue for the State government. The Business Profits Tax (BPT) is the single largest tax revenue source the State had in SFY 2017 at $385.8 million, and the Business Enterprise Tax (BET) was the fourth largest at $252.0 million. These two taxes are filed together and counted together. These two taxes also interact; the BET can be used as a credit against the BPT, for example. The BPT and BET both play very important roles in the State’s revenue system. Their combined contributions to the State’s General Fund and the Education Trust Fund comprise a little more than a quarter of the revenue collected in those two funds.
While they are filed and analyzed together, the BPT and BET are rather different taxes. The BPT is closer to a traditional state corporate income tax, collecting from business profits attributable to economic activity within the state. The BET is relatively unique among state taxes. It is a tax on compensation, interest, and dividends paid or accrued, which provides a much broader tax base than the BPT. A company that does not earn a profit might still pay BET on compensation dispensed, for example. Both taxes are in the midst of a long series of planned rate reductions that began in 2015 and are scheduled to continue until 2021. These two businesses taxes have driven much of the State’s recent revenue growth, coming in considerably higher than projections in the State Budget following economic growth in 2015 and 2016 and again in early 2018 following the federal tax overhaul. However, as the more recent business tax receipts increase was likely due to changes in business behavior following federal tax changes and not due to proportionate growth in the economy, these sharply higher revenues may not be sustained.
Restaurant Meals and Home Sales
Although the two primary business taxes have driven the lion’s share of the most recent State surpluses, two other large taxes helped drive State revenues higher after the economy picked up speed following slow growth in the aftermath of the 2007-2009 Recession. The Meals and Rentals Tax has been a reliable source of State revenue growth since approximately 2013 and was the State’s third largest tax revenue source in SFY 2017, collecting $314.8 million that was transferred to the State’s General and Education Trust Funds. This tax levies 9 percent on food or beverage purchases from restaurants and certain “to go” and prepared meals as well as on hotel room and automobile rentals. Of Meals and Rentals Tax receipts, law directs 3.15 percent to the State’s travel and tourism development agency, 40 percent to municipalities based on population, and an additional portion is set aside for certain school building bonds and for the costs of administering the tax. Businesses collecting the taxes may keep 3 percent of those taxes collected as compensation for proper handling. Notably, the 3.15 percent contribution to tourism development has been suspended. Also, the portion distributed to municipalities based on population has been held at a set amount of dollars in current law, and for SFY 2017 was budgeted to be about 21 percent of revenue collected through the Meals and Rentals Tax.
The Real Estate Transfer Tax has also driven revenue growth since the Recession but has struggled recently. The State’s eighth largest tax revenue source, with $141.7 million in SFY 2017, saw revenues grow by more than ten percent from the prior year in 2013, 2015, and 2016, with revenue growth still relatively strong in other recent years. Constrained supply in the housing market has limited its growth and may continue to hamper its potential going forward. The Real Estate Transfer Tax is a tax levied on both the buyer and the seller in any sale of, or sale of interest in, real estate, with certain exemptions.
Taxing Property Statewide and Keeping It Local
The Statewide Education Property Tax (SWEPT) is peculiar among the State’s revenue sources for several reasons. Created in 1999 to bolster the new Education Trust Fund, this tax is set to raise revenue based on a calculated statewide property value, with certain exemptions, but collects revenue through property taxes administered locally. While it formerly used set property tax rates, the SWEPT was altered in 2005 to have rates adjusted each year to collect a targeted amount of revenue. This amount of revenue is pegged at $363 million in State law and is not adjusted for inflation, which means that as the value of a dollar declines, this revenue source will provide less real spending power to fund education.
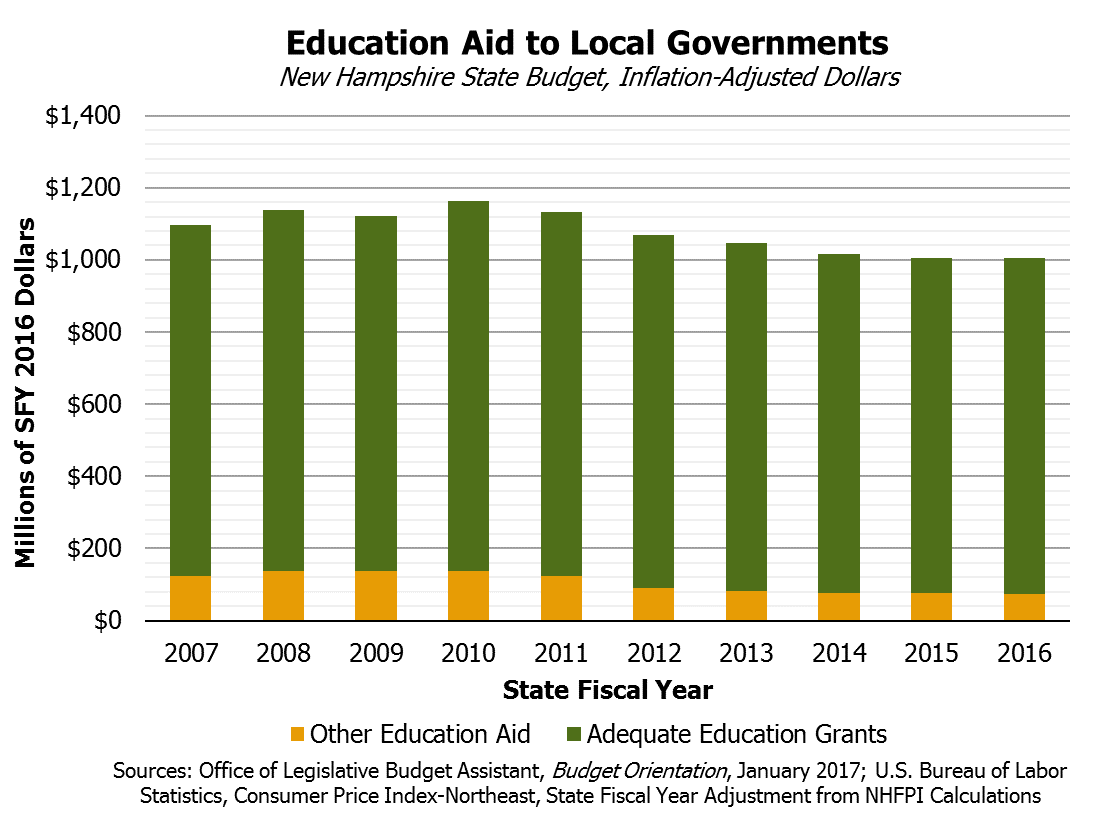
Although this is a State tax and the $363 million collected by it are credited to the Education Trust Fund in published State financial documents, the dollars do not actually flow to the State. The SWEPT raises revenue to support the State adequate education grants; in SFY 2017, it raised about 39 percent of all funding necessary to support these grants statewide. Most municipalities do not raise enough to fulfill the amount required for adequacy grants, so money from other State tax revenue sources fills the gap.
However, some towns apply the statewide tax rate and raise more than enough money to cover their entire adequacy grants. These communities tend to have some combination of high property values and low student populations. The State formerly required that revenue collected through the SWEPT in excess of the amount needed to cover the adequate education grants be provided to the State. A law change in 2011 removed the requirement, and all SWEPT revenue now stays at the local level.
Sources in Decline
The Tobacco Tax and the Communications Services Tax exemplify some of the risks of relying on relatively small revenue sources dependent on certain types of economic activity. The Tobacco Tax, which was New Hampshire’s sixth largest tax revenue source in SFY 2017 at $218.6 million, collects almost all the generated revenue from cigarette sales. With cigarette sales in long-term decline, this revenue source should not be expected to grow robustly.
The Communications Services Tax, sometimes referred to as the “telephone tax,” is a declining revenue source. In 2012, the Legislature changed this 7 percent tax to explicitly exclude Internet services. Since that time, revenue has fallen dramatically, dropping from about $77 million in the year before the law changed to $47 million in SFY 2017. The declining use of landline phones and shifting of communications to Internet-based services suggests this revenue source will continue to decline.
Although these are the two largest revenue sources currently facing long-term declines, they are indicative of the risks some other revenues sources might face. These revenue losses, should they continue as expected, may need to be counterbalanced by intentional increases in other revenue sources over time to pay for essential services.
Other Tax Revenue Sources
The Medicaid Enhancement Tax, the state’s fifth largest tax at approximately $227 million in SFY 2017, is a tax on charges inpatient and outpatient hospitals make for services minus certain expenses. These dollars are used to collect matching dollars through the federal Medicaid program, and the proceeds pay for uncompensated care reimbursements to hospitals and other parts of the Medicaid program.
The Motor Fuels Tax, which was the State’s seventh largest tax in SFY 2017, is 22.2 cents per gallon of gasoline or diesel fuel and is not adjusted for inflation. The Utility Property Tax also charges certain electricity, fuel, water, and sewer utilities at a statewide rate of $6.60 per $1,000 in property. The State also levies the Insurance Premium Tax on premiums charged by insurers and the Interest and Dividends Tax on income collected by individuals from certain earnings on existing assets, such as stocks and bank accounts.
Table 2: Education Aid to Local Governments
Enterprising Beyond Taxes
The State’s revenue system also draws on enterprise funds, which are revenues generated from business-like activities that are government operations. Sales at Liquor Commission stores, lottery tickets, Keno and other regulated gaming, and tolling on the Turnpike System are all examples of revenues funding State operations that are not collected through taxes. Both the Liquor Commission, which runs the New Hampshire liquor stores, and the Lottery Commission, the body administering the State lottery and certain gaming activities in the State, must provide their profits after operating costs to the State. The Liquor Commission’s profits mostly go to support the General Fund, while Lottery Commission profits (including from Keno gaming) primarily support education grants. The Turnpike System is a similar type of State enterprise, but it only uses proceeds to operate, construct, and maintain the three State turnpikes.
The Local Revenue System: One Major Tax and Limited State Revenue
Unlike the State’s revenue system, local governments have a limited set of tax revenue options. Local governments, including municipalities, school districts, and county governments, raised about 99 percent of their tax revenue from property taxes in fiscal year 2015. Accounting for all local revenue, including grants from the State and federal governments, school lunches, and other revenue sources, property tax revenue accounted for approximately 60 percent of the revenue. The total statewide local property tax levy in tax year 2017 was about $3.3 billion.
Of all State and local tax dollars collected in New Hampshire, about two out of every three are collected through property taxes, and 90 percent of those are local property taxes. About 60 percent of all State and local taxes collected in New Hampshire are collected at the local level, rather than by the State.
With property taxes being the paramount tax revenue source, local governments often rely on non-tax sources, such as fees, and grants from the State government. State statute limits tax and fee options for local governments, and the State also controls the amount of grant revenue going to municipalities from the State. The amount of grant revenue shared has changed over time, particularly during and following the Recession, when several key revenue sharing programs were either altered or suspended.
The amount of Meals and Rentals Tax revenue shared with municipalities is governed by a formula designed to bring the percentage distributed to cities and towns to the 40 percent identified in statute, but the planned increases in that formula have been halted, with increases provided in an ad hoc fashion since the Recession. Another revenue sharing program provided approximately $25 million each year in SFYs 2007, 2008, and 2009, but was eliminated from the SFYs 2010-2011 State Budget and has not been reinstated. The contributions to retirement payments for police and fire departments and school teachers were over $50 million per year just before the Recession but were eliminated after SFY 2012. Funding for highway and bridge grants has fluctuated in aggregate during this time, while environmental grants for water and pollution projects dropped from about $17 million a year in SFYs 2007 and 2008 to about $8 million in the SFY 2018 budget.
There have been grants through other programs outside of the State Budget. The Legislature has taken advantage of year-end and budget surpluses to shift some funding to local communities. The unrestricted revenue surplus at the end of SFY 2016 stood at approximately $150.5 million, while the SFY 2017 revenue surplus was $96.4 million and SFY 2018’s is estimated to be $129.3 million. The Legislature has appropriated most of these additional revenues, including last year’s decisions to appropriate $36.8 million to local highway and bridge projects, $2.25 million more to local school building aid, and the $18.7 million remaining in the SFY 2017 surplus after other appropriations to the Public School Infrastructure Fund. However, the State has not decided to resume the suspended or halted revenue sharing programs.
Table 3: Non-Education Aid to Local Governments
Surplus revenues may be temporary, especially in the case of recent business tax revenues, which would make funding ongoing programs with these revenues risky. However, the aid provided to municipalities has been temporary as well, increasing the difficulty local governments have in planning future expenditures and projects.
The State government also faces ongoing questions about the revenue it might receive from the federal government. Proposals considered last year to dramatically alter Medicaid, for example, would likely have reduced funding the State receives relative to existing law by approximately $1 billion between 2020 and 2026. Increasing deficits and added debt following federal decisions regarding revenues and expenditures since late last year may lead to difficult fiscal decisions in the future, which might affect federal revenues to the State. Federal decisions regarding grants to New Hampshire may impact the willingness of State policymakers to commit to more revenue sharing with local governments.
Aid to local governments has the potential to ease upward pressure on property taxes and increasing some consistent form of revenue sharing with local governments may help alleviate some of the challenges they face. State and federal policy decisions are linked to the capacities of local governments to deliver quality services to their residents, and policymakers at all levels should be aware of these interactions and the different abilities at each level to fund public services.
Phil Sletten is a policy analyst with the New Hampshire Fiscal Policy Institute. Phil can be reached by phone at 603.856.8337 or by email at psletten@nhfpi.org. For more information, see the New Hampshire Fiscal Policy Institute’s Revenue in Review resource at www.nhfpi.org.